 |
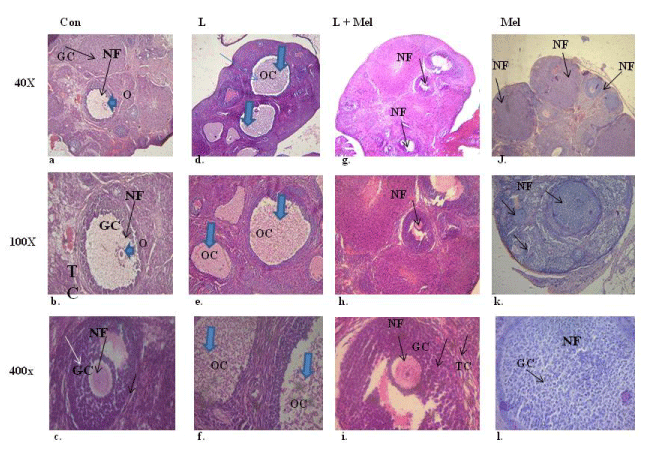
| Figure 2: Histomicrograph showing changes of the rat ovarian tissues in Con: Control, L: Letrozole, L+Mel: Letrrozole+Melatonin and Mel: Melatonin groups (40X upper panel; 100 X middle panel and 400X lower panel) a, b, c) showing normal follicle growth in Control Group (Con), GC: Granulosa Cell, O: Oocyte, OC: Ovarian Cyst, NF: Normal Follicle, TC: Theca Layer; d, e, f) Showing induction of poly cystic ovarian syndrome following letrozole treatment; g, h, I) melatonin given to letrozole induced PCO rats showing reversal on healthy ovarian follicles, j, k, l) Melatonin treatment maintaining the normal ovarian follicle architecture. |