 |
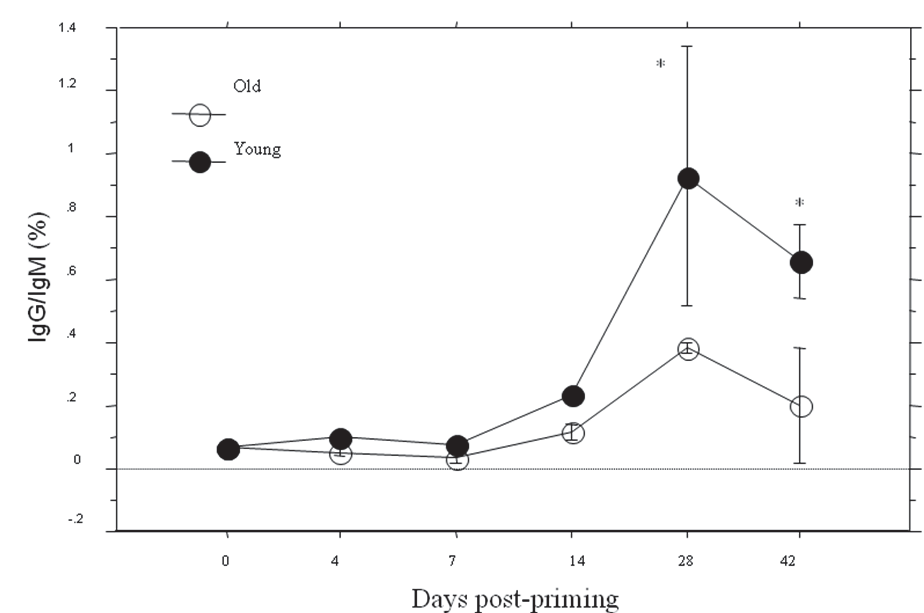
| Figure 4: Kinetic change of serum IgG/IgM ratio. Data extrapolated from the same animals as above Figure 2. The curve of the IgG/IgM ratio was significantly lower in old mice than that in the young mice (P<0.01) postpriming. The data were presented in means ± SE. Compare the young and the old mice at corresponding time points, *P<0.01. |