 |
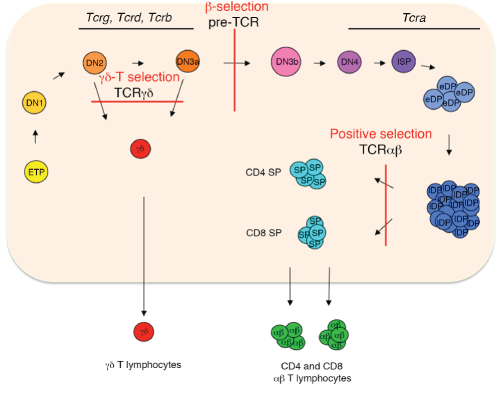
| Figure 1: Temporal control of T-cell gene rearrangements and thymocyte development. The thymus is represented as a light pink rectangle. Schematic representation of thymocyte maturation depicting the various developmental stages and the TCR gene rearrangements is shown. β-, γδ-, and positive selection, which depend on the expression of pre-TCR, TCRγδ or TCRαβ, respectively, are indicated in red. T cell maturation is indicated by the transition from yellow to red (maturation to γδ T lymphocytes) or green (maturation to αβ T lymphocytes). |