 |
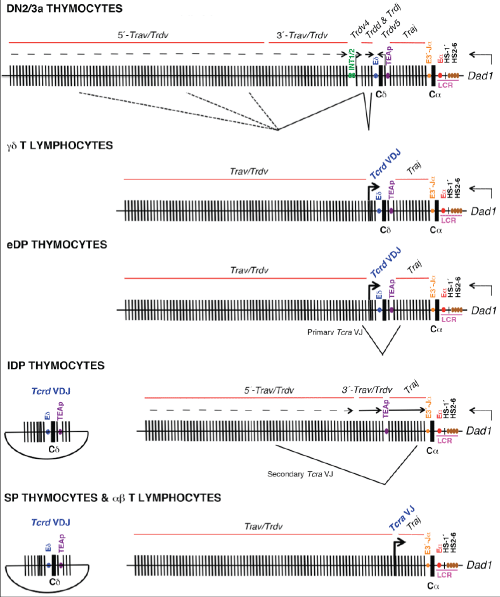
| Figure 2: Representation of the different structure of the Tcra/Tcrd locus during T-lymphocyte development. The V, D, and J gene segments are represented by black narrow rectangles. The Cδ and Cα regions are represented by black large rectangles. The 1.6-Mb 5-locus region includes the Trav/Trdv gene segments, and the 0.1-Mb 3´-locus region includes the Trdd and Trdj gene segments, the Cδ region, the Trdv5 gene segment, the Traj gene segments, and the Cα region. Red lines indicate the areas occupied by Trav/Trdv, Trdd and Trdj , and Traj gene segments. The position of the functionally relevant regulatory elements is indicated as follows: INT1/2 as green circles, Eδ as a blue circle, TEAp as a purple circle, E3´-Jα as an orange circle, LCR as a pink line, Eα as a red circle, HS-1´as a black rectangle, and HS2-6 as brown ovals. The dashed lines represent the possible different rearrangements along the Trav/Trdv gene segment cluster and the continuous lines represent the Tcrd DJ recombination in DN2/3a thymocytes and the primary and secondary Tcra VJ recombination in DP thymocytes. The arrows represent regions of active germline transcription. Arrows anchored to a particular V gene segment represent the transcripts originated from specific V promoters. The rearranged Tcrd VDJ and Tcra VJ transcripts are written in bold blue characters. Low transcription is represented by dashed lines (low transcription level) whereas the width of the continuous lines is proportional to the level of transcription (medium or high). The deleted Tcrd locus in DP and SP thymocytes, and in αβ T lymphocytes, is represented as a separate circularized DNA fragment containing the rearranged Tcrd and several unrearranged Trav/Trdv and Traj gene segments produced as a consequence of a Tcra VJ recombination. |