Stastical analysis
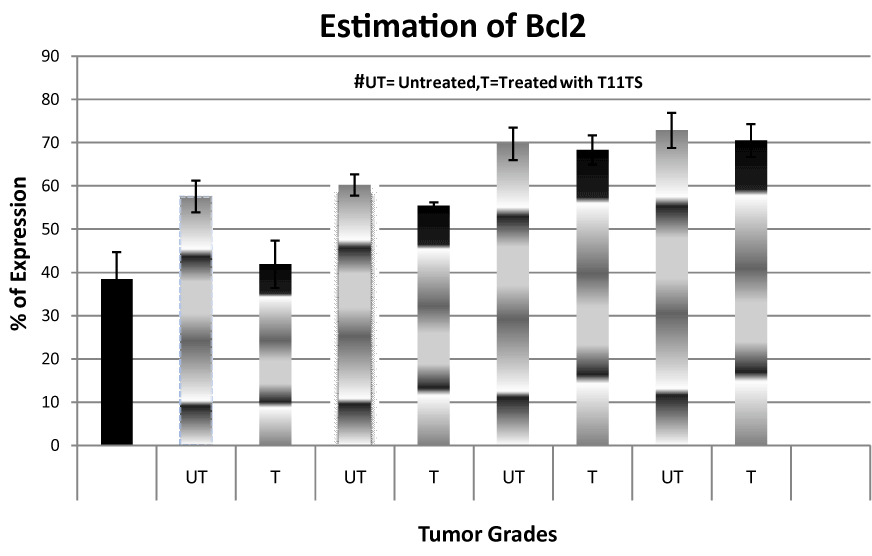
(I) Meningioma (Disease control) – M=38.382, SD=6.287, p<0.0001
(II) Grade I (Untreated)–M=57.498, SD=3.677(Treated), M=41.847, SD=5.468, p<0.0001
(III) Grade II (Untreated)–M=60.17, SD=2.46, (Treated) M=55.34, SD=0.8067, p<0.0001
(IV) Grade III (Untreated)–M=69.690, SD=3.763, (Treated) M=68.302, SD=3.358, p>0.05.
(V) Grade IV (Untreated)–M=72.788, SD=4.063, (Treated) M=70.472, SD=3.520, p>0.05.
*M: Mean; SD: Standard Deviation
Meningioma were used as disease control. Significant enhancement in Bax expression were observed in T11TS treated cells of grade I and II glioma. No such significant change reported between T11TS treated and non treated groups of grade III and IV glioma.