 |
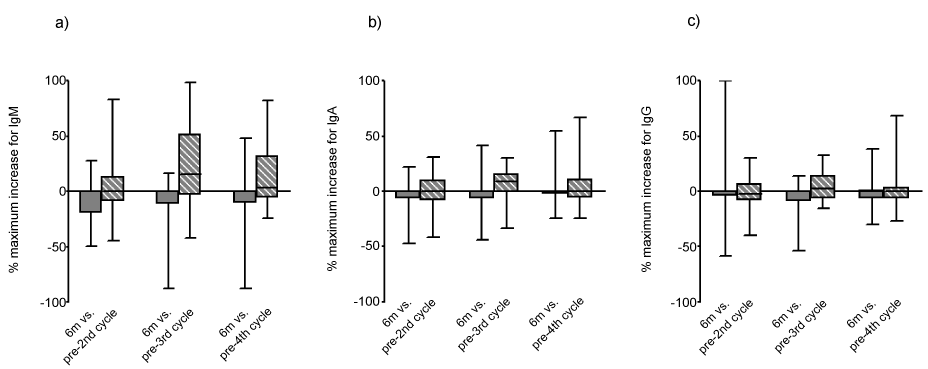
| Figure 3: (A) Shows the percentages of maximum decrease for each patient at 6 months following the 3rd cycle of RTX in the 6 month fixed cohort. (1) Shows the percentage maximum decrease of Ig levels 6 months after the 3rd cycle of RTX therapy in the non-fixed retreatment cohort plotted against time after start of first cycle of RTX. Linear regression lines are shown but there was no significant correlation between time and %maximum decrease for any Ig class. |