 |
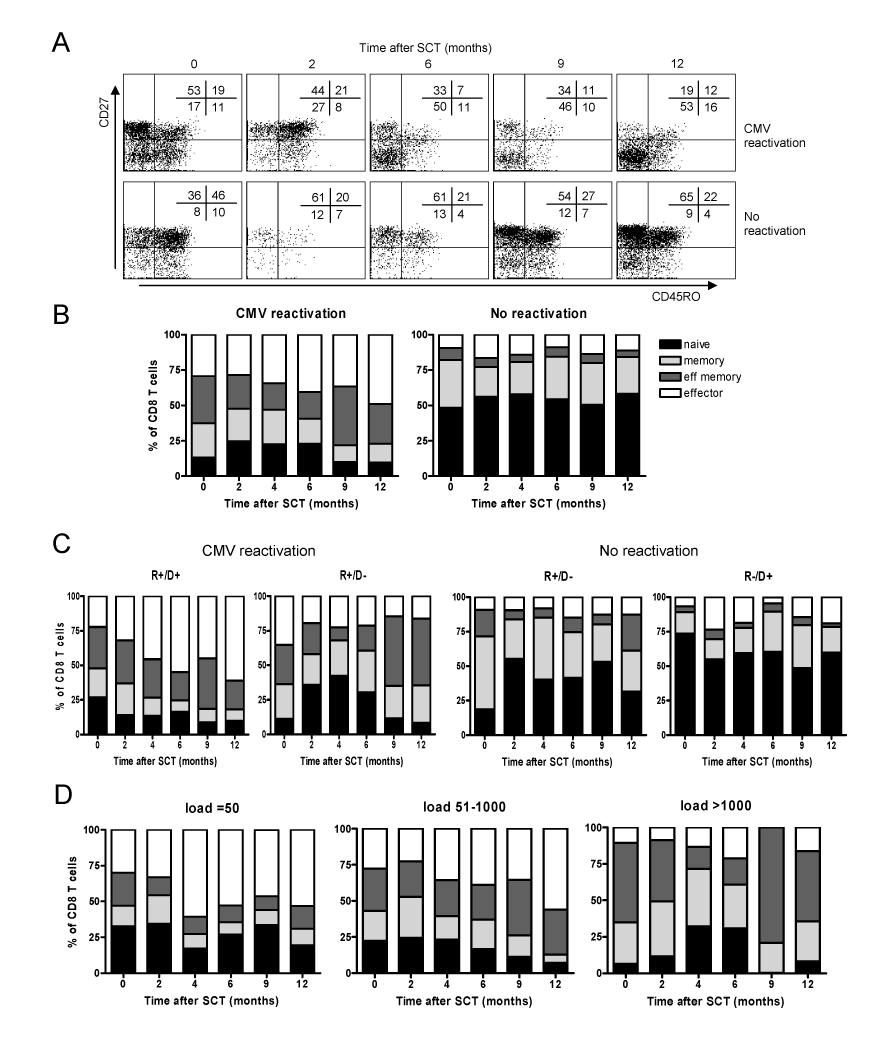
| Figure 1: Longitudinal phenotype differentiation after SCT in patients with and without CMV-reactivation. A. Representative examples of phenotype differentiation of CD8+ T cells from a patient with (upper panel) and without CMV-reactivation (lower panel). Percentages in each quadrant are shown in the upper right corner. B. Mean percentage of naïve (CD45RO-/CD27+, black), central-memory (CD45RO+/CD27+, light grey), effector-memory (CD45RO+/CD27+, dark grey) and effector (CD45RO+/ CD27+, white) CD8+ T cells in patients with and without CMV-reactivation. C. Phenotype differentiation of CD8+ T cells depending on recipient and donor CMV-serostatus in patients with and without CMV-reactivation. D. Phenotype differentiation of patients with CMV reactivation depending of the height of the peak viral load within one year post-SCT (copies/ml). |