 |
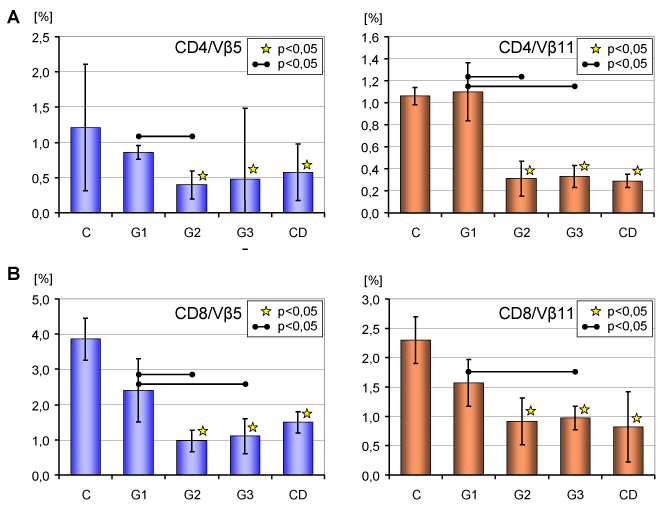
| Figure 5: Analysis of the CD4 and CD8 lymphocytes with Vβ5 and Vβ11
antigens: CD4/Vβ5 and CD8/Vβ5 cells (A), and CD4/Vβ11 and CD8/Vβ11 cells
(B) in the 26th week of the experiment (n=20; n=4/per experimental group). The
values for the CD group are the control levels measured in the donor mice.
*p<0.05, comparison to the control group; |