|
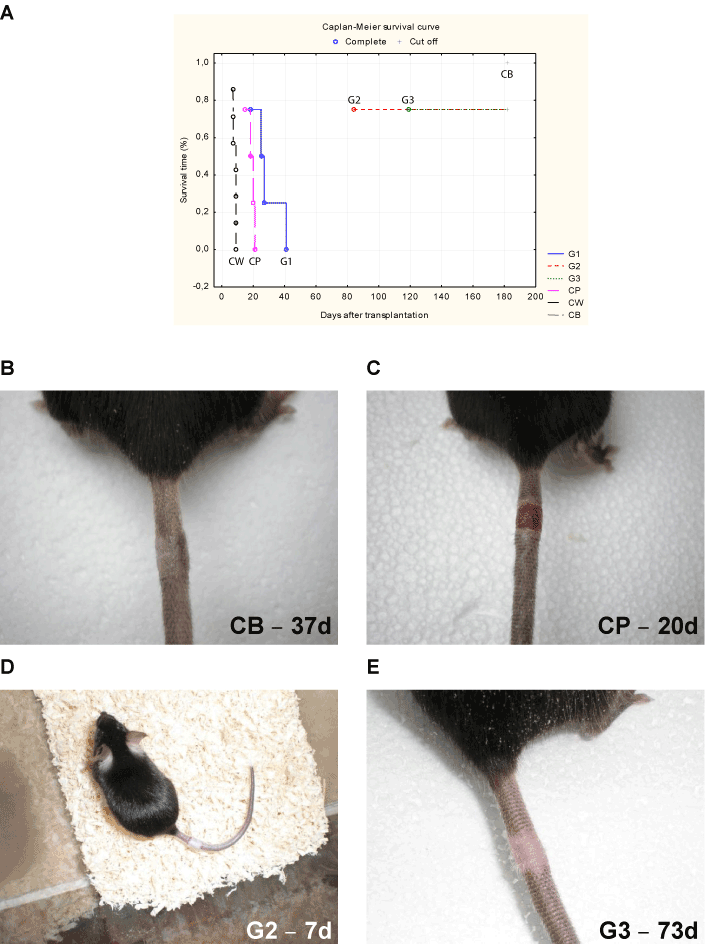
| Figure 6: Kaplan-Meier curve of skin graft survival (A) (n=31; n=4/per experimental group). The experimental (G1-G3) and control (CPmice exposed to induction protocol without bone marrow transplantation, CWmice with skin allografts without any other treatment, CBmice with syngeneic skin grafts without any other treatment) groups are shown. Examples of skin grafts for the CB group (control mice that received syngeneic grafts-B), the CP group (control group of mice that was subjected to the induction protocol only-C) and the G2 and G3 experimental groups on various days after transplantation (D, E). |