 |
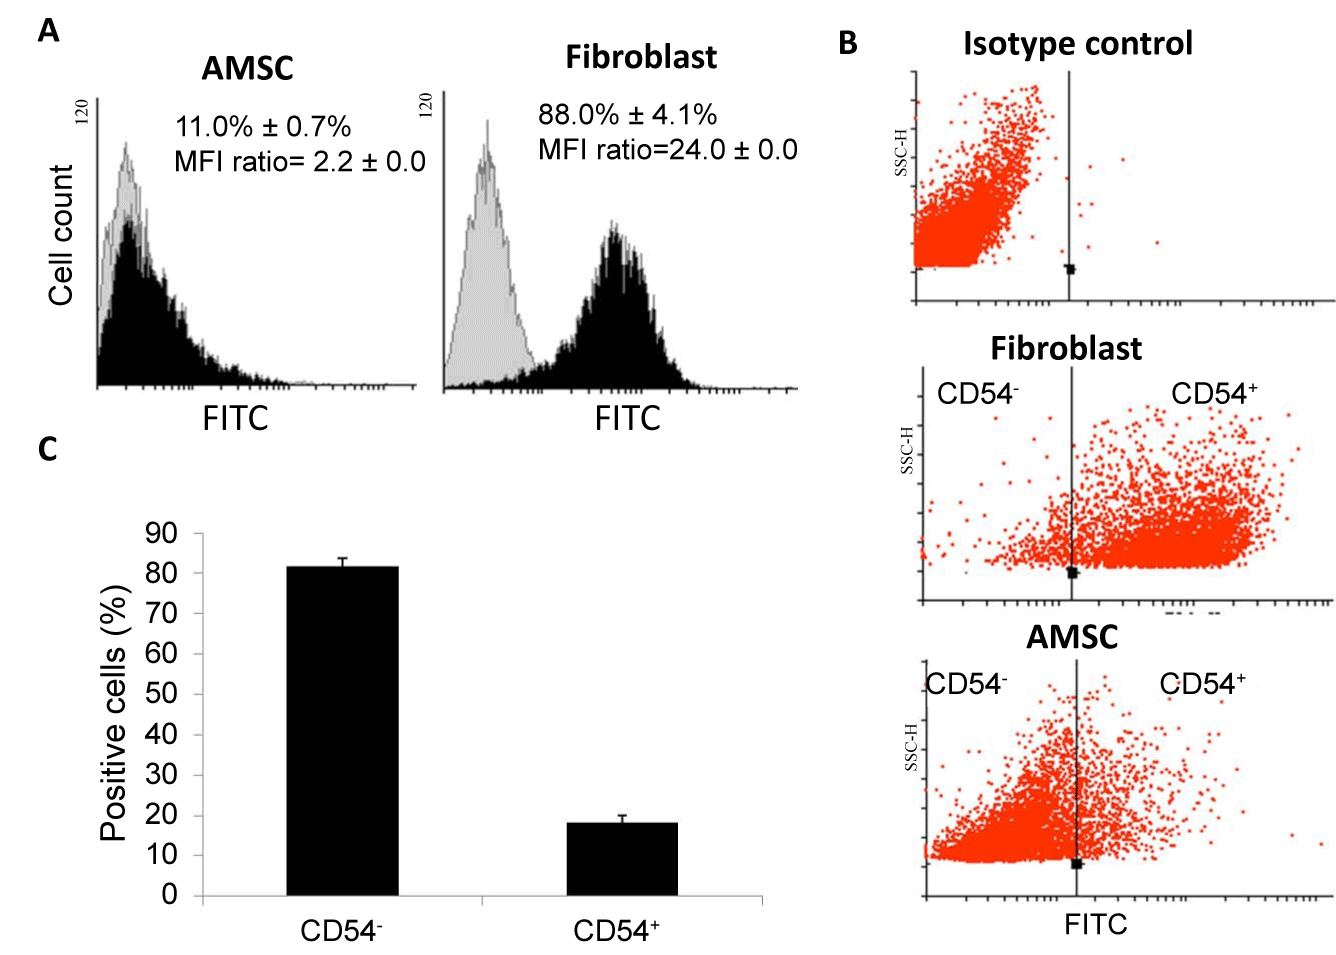
| Figure 2: Quantitative evaluation of CD54 protein expression in AMSCs and fibroblasts. (A) Early passage AMSCs and primary human dermal fibroblasts were stained with anti-CD54 specific antibody (black histograms) or an isotype-matched control antibody (grey histograms). Expression of CD54 was analyzed by flow cytometry. MFI of CD54 reactivity normalized to the MFI of the isotype control. Means ± SEM for 3 independent runs are shown. (B) Cells stained with anti-CD54 specific antibody or an isotypematched control antibody was gated on side scatter dot plot versus the FITC profile. (C) Early passage AMSCs were harvested and sorted with anti-CD54 specific antibody by MACS. |