 |
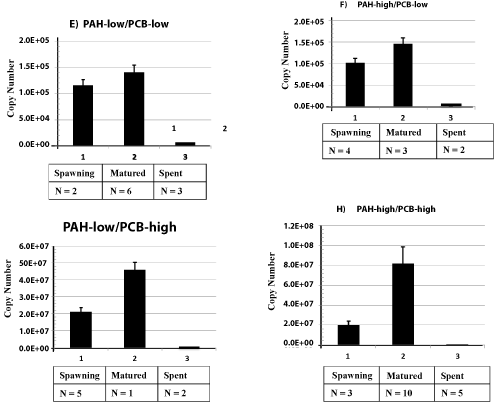
| Figure 6: Effect of PCB and PAH in combination on aromatase CYP19A transcript levels. Bars represent means ± 1S.E. of aromatase CYP19A transcript levels of female tomcod. Sample size is shown below x-axis (see materials and methods for a description of the reproductive stages). The above pattern is different from the expected CYP19A transcription pattern, which is, matured>spawning>spent. |