 |
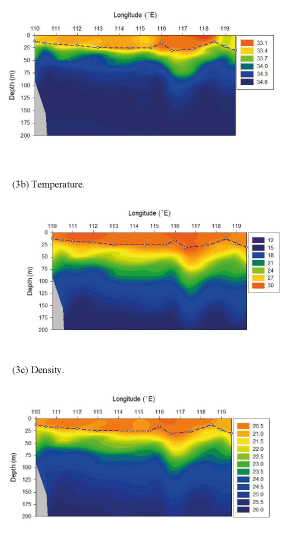
| Figure 3: Spatial variations of (3a) salinity, (3b) temperature and (3c) density in the top 200m along the 18°N transect (110-119.5°E) in June 2014. The values of mixed layer depth (MLD) were derived from a drop of 0.5°C from the sea-surface temperature (Karl and Lukas, 1996) and shown with blue short-dash line. The gray circles represent sampling stations. (3a) Salinity. |