|
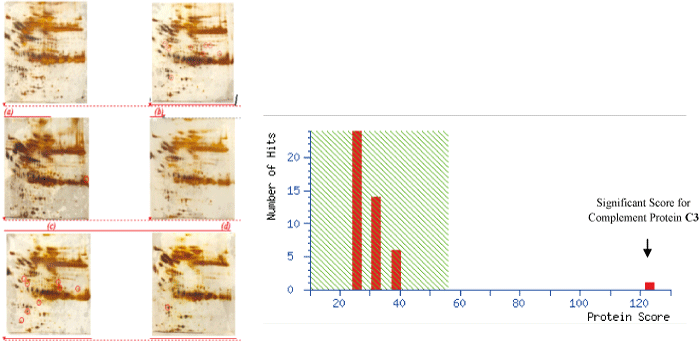
| Figure 1: Representative 2-D gel images of Antarctic exposed Human Serum following albumin and IgG depletion. Proteins (500 μg) were separated by IEF using pH 3-10, 17 cm IPG strips (BioRad, USA) and 12% SDS PAGE. The gels were silver stained and analyzed by Progenesis Same spots 2D gel image analysis software (Nonlinear Dynamics). (a) Control (b) Ship Journey (c) March (d) May (e) August (f) November. Spot numbers represent differentially expressed proteins during ship journey and Antarctic stay compared to control. (g) Mascot Score Histogram: Protein score is -10*Log (P), where P is the probability that the observed match is a random event. Protein scores greater than 56 are significant (p<0.05). |