 |
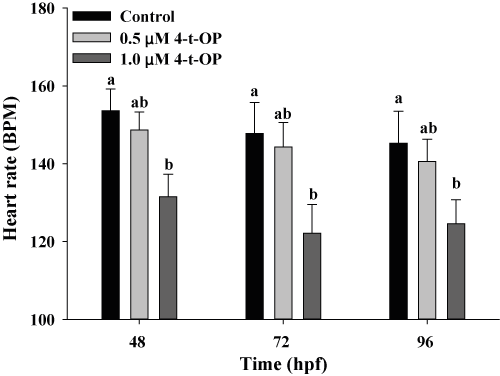
| Figure 2: The effect of 4-t-OP on Tg(fil-1:EGFP) zebrafish heart rate following the 96 hours exposure. Data are presented as mean ± SD of three independent experiments. The asterisk (*) denotes statistically significant differences (p<0.05) between control and 4-t-OP treated groups as measured by Student’s t test. |