 |
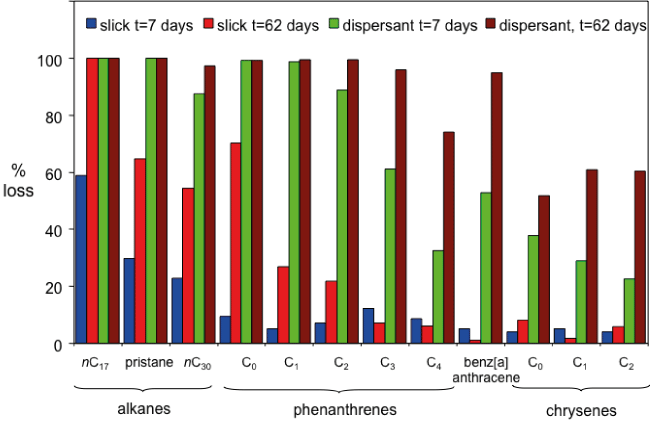
| Figure 2: Losses of some representative hydrocarbons from the oils floating as a slick or with dispersants. Since there were no statistical differences between the experiments with the different dispersants, this figure presents the average data for all three – typical ‘standard deviations’ were <10%, and values under 10% loss are likely not significant. C0 indicates the parent aromatic, C1 the methyl substituted forms, C2 the dimethyl and ethyl substituted forms, etc. |