|
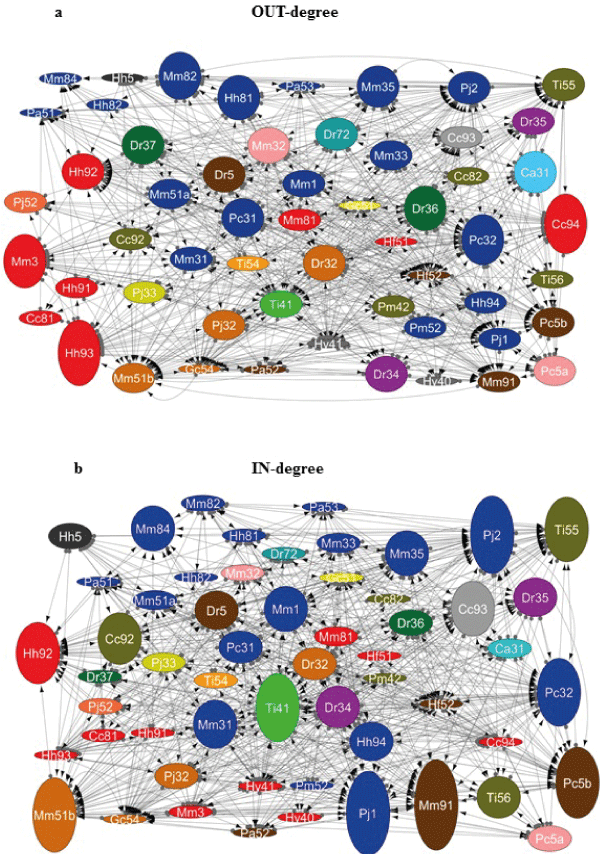
| Figure 2: Network analysis of antagonistic interactions among sponge-associated bacteria. A 56x55 array of tests was performed and the results were converted to graphs using the Cytoscape 3.1.0 software (http://www.cytoscape.org). Each node represents a bacterial strain. Each line (connection) represents an antagonistic interaction from an active strain (grey dot) towards a sensitive strain (arrow). Strains isolated from the same bacterial genus have the same fill color. Strains isolated from the same sponge species have the same initial letters: Ca (Clathrina aurea), Cc (Cliona aff. Celata), Dr (Dragmacidon reticulatum), Gc (Geodia corticostylifera), Hv (Haliclona vansoesti),Hf (Haliclona fugidia), Hh (Hymeniacidon heliophila), Mm (Mycale microsigmatosa),Pa (Pachychalina alcaloidifera),Pm (Paraleucilla magna),Pc (Petromica citrina), Pj (Polymastia janeirensis),Ti (Tedania ignis). Node size is proportional to the number of antagonistic interactions with other isolates: in (a) to the number of connections leaving the node (strain activity) (“out-degree”) and in (b) to the number of connections reaching the node (strain sensitivity) (“in-degree”). |