 |
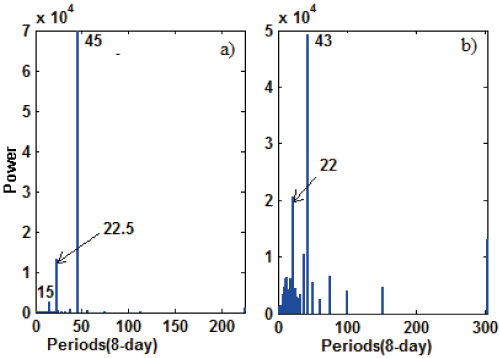
| Figure 5: Periodograms of 8-day averaged SST (a) and CHL-a (b). Note that, in each case, the mean peak (period) found using the Fourier decomposition of the individual SSA temporal principal component, corresponds to one of those identified in the original time series. |