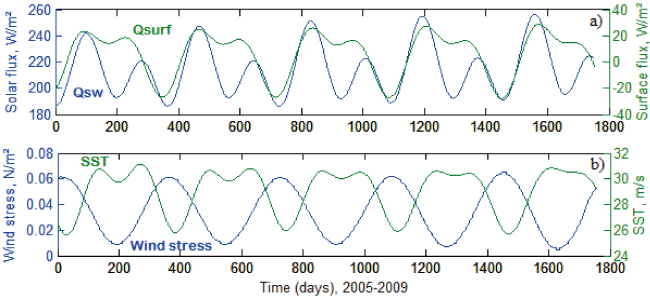
Figure 10:
SST daily time series compared with the shortwave radiation (Qsw), net surface heat flux (Qsurf) and wind stress.