 |
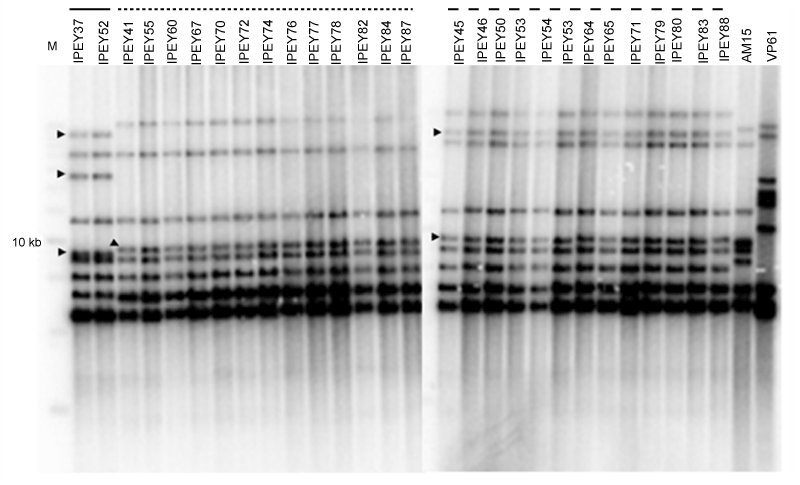
| Figure 1: Ribotype pattern of test strains along with V.harveyi (AM15) and V.parahaemolyticus (VP61) standard strains after digestion with BglI restriction enzyme. Differences in band positions are pointed by arrow (►). Three clusters were marked by solid line (Cluster I), square dot (Cluster II) and dash line (Cluster III). |