 |
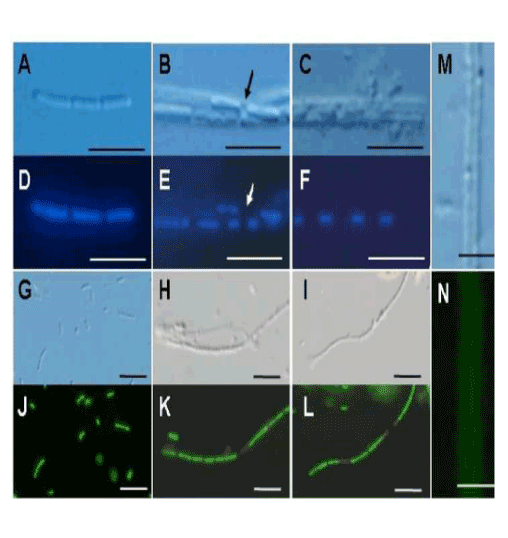
| Figure 2: DIC microscopy images and specific staining of bacterial cells in 1–3-day cultures. (A, D) A line of cells lacking sheath and its positive response to DAPI staining of the cells at day 1. (B, E) Two lines of cells surrounded by an immature sheath and their response to DAPI staining at day 2. (C, F) An arrow shows the intercellular gap. A line of cells surrounded by a relatively thick sheath and its response to DAPI staining at day 3. Note that separate cells are enclosed in the sheath. (G-L) V/D staining of cells in 1- to 3-day cultures in this order. (G-I) DIC microscopy images and (J-L) fluorescence images. (M, N) DIC microscopy image and positive response to PHA-E lectin, respectively, at day 2. Scale bar: (A-F, M and N) 5µm, (J-L) 10 µm. |