 |
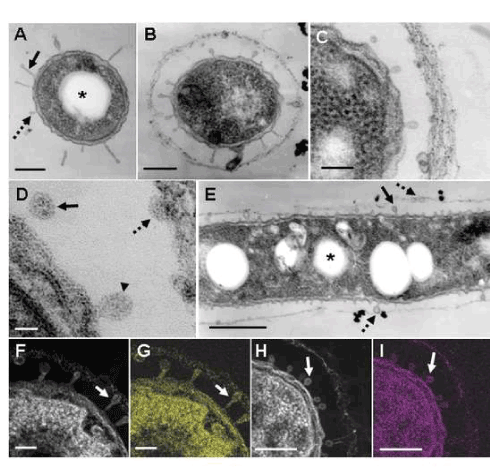
| Figure 3: TEM, STEM and HAADF-STEM images and elemental maps in ultrathin sections prepared at day 1. (A) TEM image of a sheath-free cell having globular and/or slender forms of exudates from the cell surface. (B) TEM image of a cell surrounded by a thin immature sheath layer. (C) Enlarged STEM image of the loosely-woven fibrils in an immature sheath in Bi-stained section. (D) A high-power STEM image of membrane-unbound globular exudates. (E) TEM image of a longitudinal section of the cell surrounded by a thin immature sheath layer. (A, D, E) Arrows indicate the exudates from the bacterial surface in various states. (F, G) HAADF-STEM image of Bi-stained cross-section of the cell and Bi distribution map. (H, I) HAADF-STEM image of U/Pb-stained cross section of the cell and Pb distribution map. (F-I) White arrow indicates the protuberances. Scale bar: (A, B, E,) 500 nm, (C, F-I,) 100 nm, (D) 20 nm. |