 |
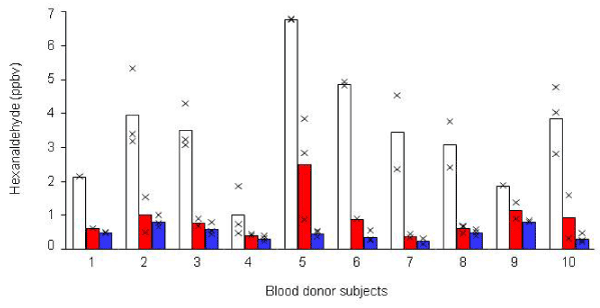
| Figure 3: Hexanaldehyde emitted in the bioreactor headspace of neutrophils (red bar) and PBMCs (blue bar) following 24 h of incubation are presented. X represents replicates. The hexanaldehyde concentrations are significantly lower from neutrophils and PBMCs compared to media (white bar). |