 |
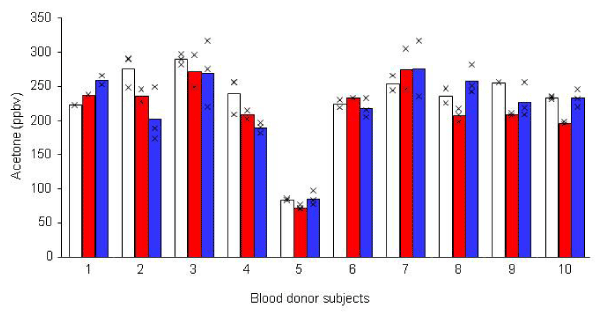
| Figure 4: The acetone concentration emitted in the bioreactor headspace of neutrophils (red bar) and PBMCs (blue bar) following 24 h of incubation are presented. X represents replicates. The emitted acetone concentrations from cell culture bioreactors in which the neutrophils and PBMCs were grown were not different from the headspace gases obtained in the media only (white bar). |