|
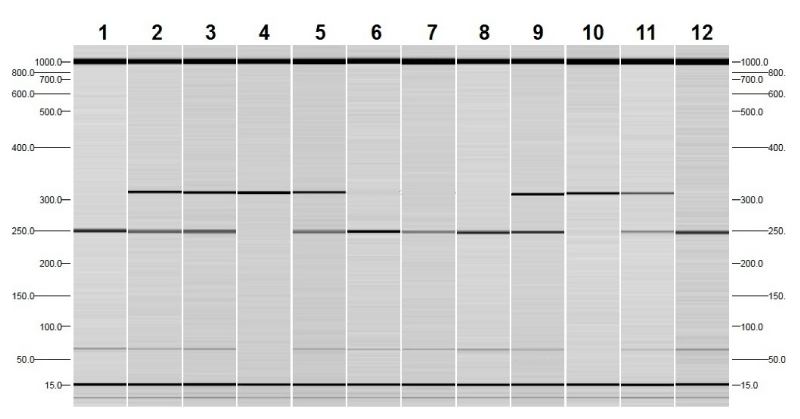
| Figure 1: Gel image using QIAxcel System-genetic analyzer. Lanes 1-12 represent different samples. Lanes 1,6,7,8,12 representing the CC homozygote (two bands), lanes 4&10 representing the TT homozygote (one band) and products in lanes 2,3,5,9,11 representing the CT heterozygote (three bands). 15 base pair and 800 base pair bands are reference markers injected before the PCR products were injected. |