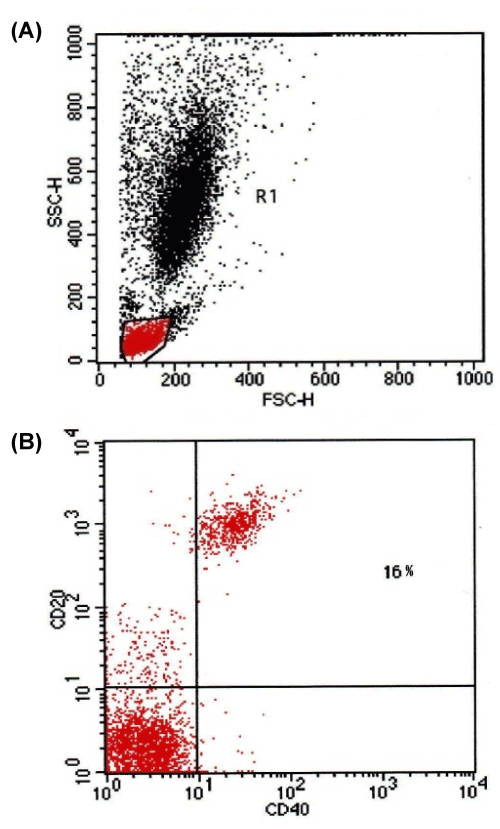
A: Dot plot of forward scatter against side scatter showing gated lymphocytes. B: Dot plot of CD20 stained by (PE) and CD40 stained by (FITC) showing CD20+ & CD40+cells in a studied case.
 |
| Figure 2: CD40 expression measured by flow cytometry: A: Dot plot of forward scatter against side scatter showing gated lymphocytes. B: Dot plot of CD20 stained by (PE) and CD40 stained by (FITC) showing CD20+ & CD40+cells in a studied case. |