 |
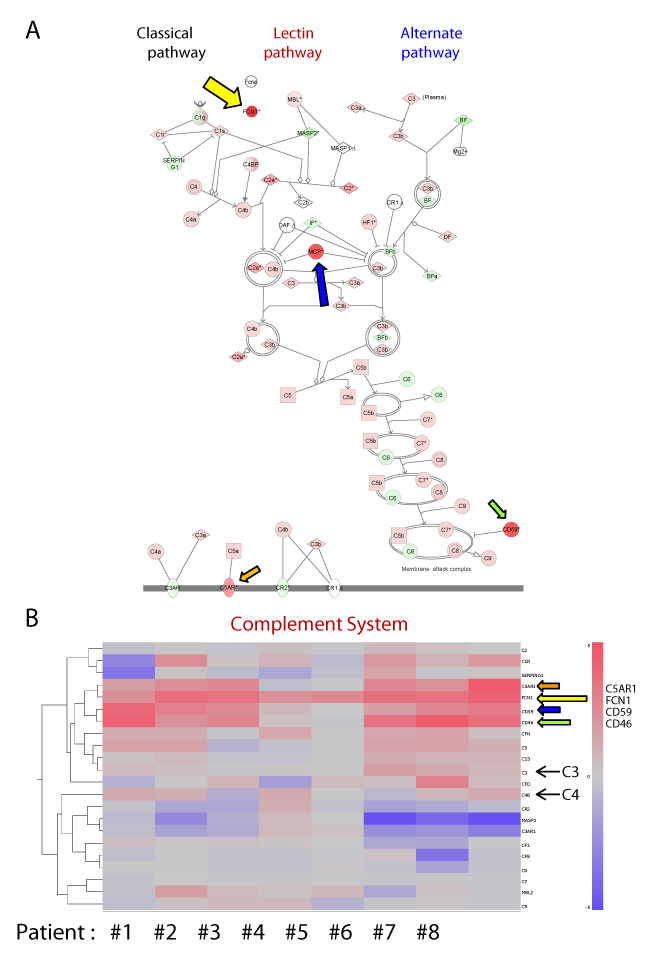
| Figure 2: Expression profiling of the microarray data for complement system genes expressed by the eight TA patients. (A) Pathway analysis of complement system genes using Ingenuity Systems IPA software. A network pathway is a graphical representation of the molecular relationships between molecules. Molecules are represented as nodes, and the biological relationship between two nodes are represented as an edge (line). All edges are supported by at least one reference from the literature, a textbook, or by canonical information stored in the Ingenuity Knowledge Base. The intensity of the node color indicates the degree of up- (red) or down- (green) regulation. Nodes are displayed using various shapes that represent the functional class of the gene product. Edges are displayed with various labels that describe the nature of the relationship between the nodes. Pathway analysis of complement system genes identified FCN1 (yellow arrow) as the most conspicuously up-regulated gene in TA patients. Membrane cofactor protein (MCP/CD46; blue arrow), CD59 (green arrow) and C5AR (orange arrow) were moderately up-regulated in TA patients. (B) Mosaic tile representation of genes involved in the complement system. The mosaic tile for FCN1 is denoted by a yellow arrow. Tile colors indicate the mean relative transcript levels in PBMCs from TA patients and normal controls; blue corresponds to a log2 ratio of -5 (down-regulation), red corresponds to a log2 ratio of 5 (up-regulation), intermediate values are represented by shades of red (pink) or blue. Gray indicates no change (see the rightmost color bar). |