 |
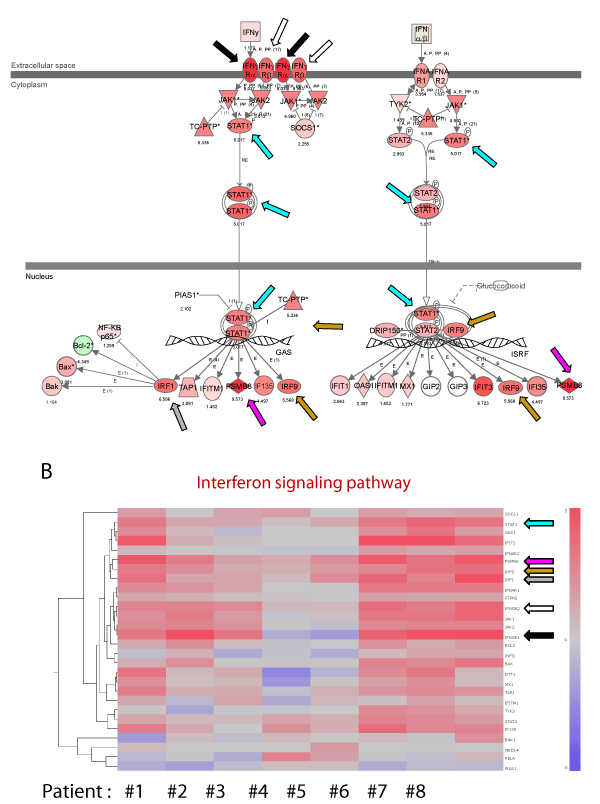
| Figure 3: Expression profiling of the interferon signaling pathway. Pathway analysis (A) and heat maps (B) identified several genes whose mRNA levels were augmented in the majority of TA patients. These gene are STAT1 (turquoise arrow), PSMB8 (pink arrow), IRF1 (gray arrow), IRF9 (ocher arrow), iIFGR1/IFGRα (black arrow) and IFGR2/IFGRβ (white arrow). Heat mapping revealed that STAT1, PSMB8, IRF1, IRF9 and IFGR1 showed increased signals in all eight TA patients, with a moderate increase noted in patients #3, #4 and #5. IFGR2 showed weak signals in patient #4 and #5. |