 |
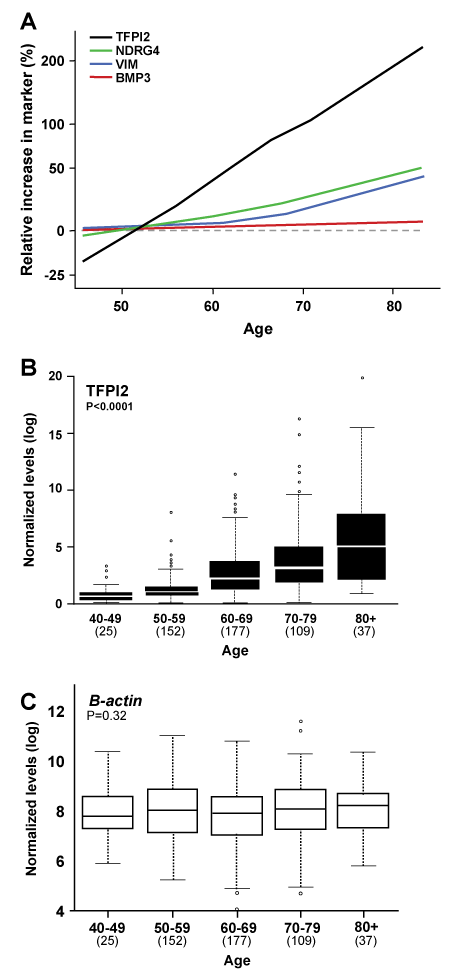
| Figure 1: Relationship of age to stool marker levels. A. Relative changes per standard deviation of age are plotted for each marker. All four methylated gene markers (plotted as solid colored lines per inserted key) increased progressively with advancing age (p<0.0001 for each). In contrast to the methylated gene markers, β-actin levels (plotted as dotted gray line) were unaffected by age (p=0.32). B. Distributions by age of observed stool levels of methylated TFPI2, the marker most affected by age. C. Similar stool level distributions by age of β-actin, which served as the un-methylated human control gene. |