|
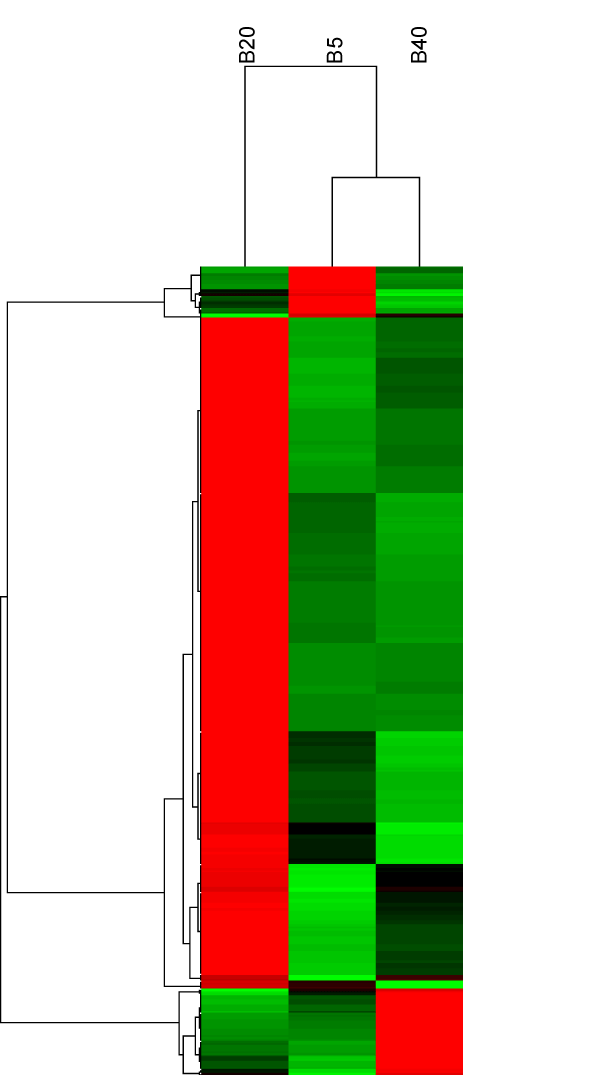
| Figure 1: Gene expression profiling. Hierarchical clustering diagram of BDE 209 induced expression changes. Jurkat cells were incubated with 5, 20 and 40 μM BDE 209 with DMSO (as control) for 48 h, all in triplicate. In the heatmap, rows represent individual genes and columns display the gene expression levels in each independent sample. Red color represents an expression level above the mean value of expression of a gene across all samples, black represents the mean and green color represents an expression level below the mean. |