 |
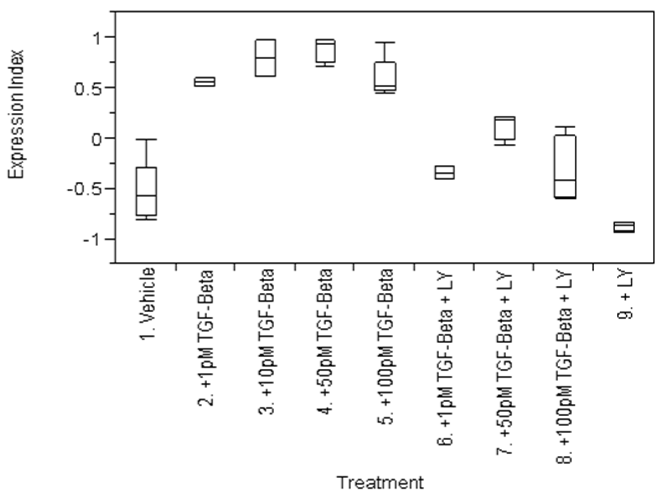
| Figure 2: Distribution of the expression index values for 375 probe-sets in normal PBMC replicates treated with various levels of TGF-β1 with and without 5 μm LY2157299 monohydrate As described in materials and methods Lane (1) Vehicle represents no treatment and lane (9) represents LY 2159299 without TGF-β1 addition. The box within each range of data points represents the upper and lower median of replicate values for each treatment group and line within the box represents the median value. The vertical line extending from the box where available represents the upper and lower range of data points for each experimental condition. |