 |
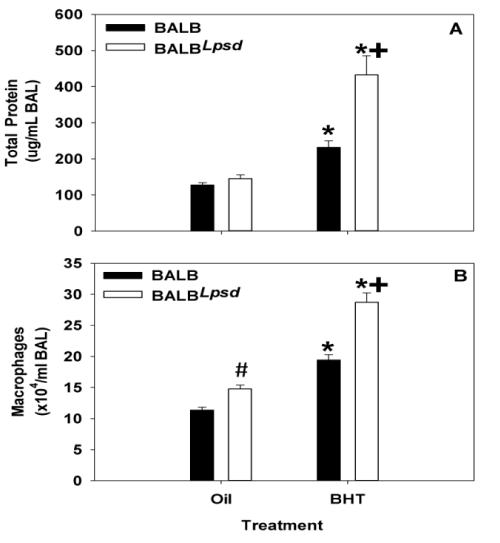
| Figure 1: BHT produces an inflammatory profile in treated mice. (A) Total protein content was increased in both strains in response to BHT, however was significantly higher in BHT treated BALBLps-d mice as indicated by the plus sign(N=5; p < 0.001). (B) Total macrophage infiltration of BALF in BALBLps-d mice is statistically significant for all treatment groups (N=5; p < 0.05). Data presented as mean and SEM. *, P<0.05 for BHT compared to oil treatment groups; +, p<0.05 for BALB versus BALBLps-d mice; #, p<0.05 for oil treatment between strains. |