 |
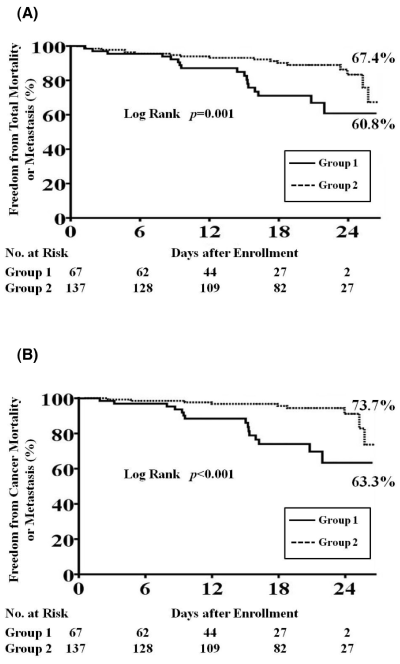
| Figure 3: Kaplan Meyer analysis: (A) The Kaplan Meyer analysis comparing the survival rate between group 1 (i.e., lipocalin 2 levels <116.7 ng/ml) and group 2 (i.e., lipocalin 2 levels ≥116.7 ng/ml) patients, demonstrating the long-term primary combined endpoint was notably higher in group 1 than in group 2 patients (p = 0.001). (B) The Kaplan Meyer analysis comparing the survival rate between group 1 (i.e., lipocalin 2 levels <116.7 ng/ml) and group 2 (i.e., lipocalin 2 levels ≥116.7 ng/ml) patients, demonstrating the long-term secondary combined endpoint was notably higher in group 1 than in group 2 patients (p < 0.001). |