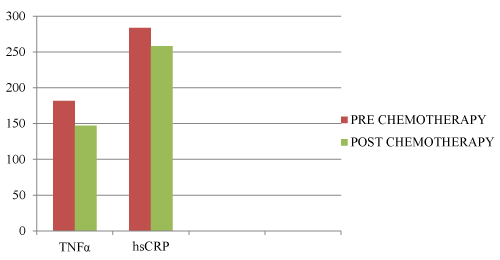
Figure 1:
Diagram showing Pre and Post chemotherapy levels of markers.