 |
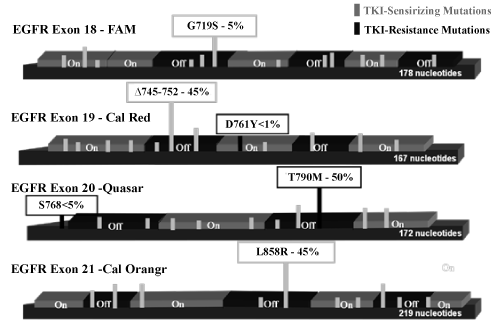
| Figure 1: LATE-PCR EGFR assay design. This diagram illustrates the distribution of Lights-On/Lights-Off probes along their corresponding amplicon targets and the length of the amplicons (gray and black bars labeled “On” and “Off” correspond to Lights-On/Lights-Off probes; thick black lines correspond to amplicon targets; light grey vertical lines illustrate TKI-sensitizing mutations; black vertical lines illustrate TKI-resistant mutations; boxes with labels mark the approximate position of mutation hotspots and specify the name and frequency of the mutation; see also Supplementary information S1). Whenever possible, Lights-Off probes were designed to bind the sites of the hotspots mutations to generate the most distinctive mutant fluorescent signatures (mutations under Lights-Off probes have the greatest impact on fluorescent signatures) [31] |