 |
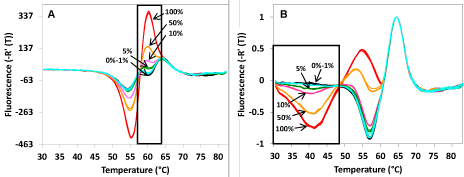
| Figure 5: Detection of mutant EGFR sequences in mixtures of normal and mutant DNA. Artificial mixtures containing different ratios of normal and mutant genomes generate fluorescent signatures that distinguished as little as 5% mutant genomes in 95% normal DNA. All samples were processed in replicates and plotted individually. Panel A: Mixtures of normal DNA and DNA from cell line NCI-H1975 carrying the T790M mutation. Panel B: Mixtures of normal DNA and DNA from cell line HCC4006 genomic DNA carrying the 9-base pair exon 19 ΔL747-E749 deletion. Black box indicates the range of temperatures where the fluorescent signatures were most discriminating for the various DNA mixtures. Percentages in the panels correspond to the percentage of mutant genomes in each mixture. Replicate set of fluorescent signature for each mixture is labeled with a different color. The overlapping 1% and 0% fluorescent signatures in each panel were labeled blue and black, respectively. The maximal difference in the fluorescent signatures between the 5% and 10% mutant mixtures was statistically significant (p< 0.002). |