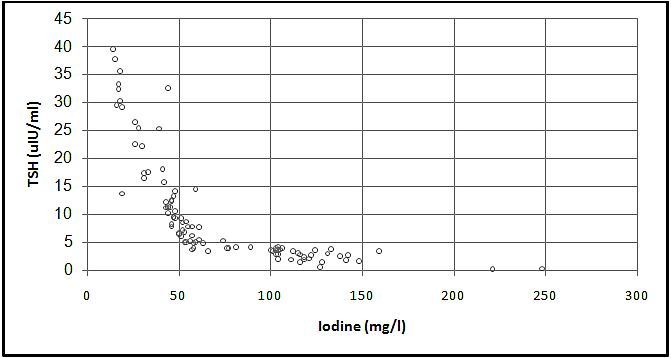
Figure 3:
Scatter diagram for TSH vs. Urinary Iodine, reflecting r = - 0.881 at P<0.001.