 |
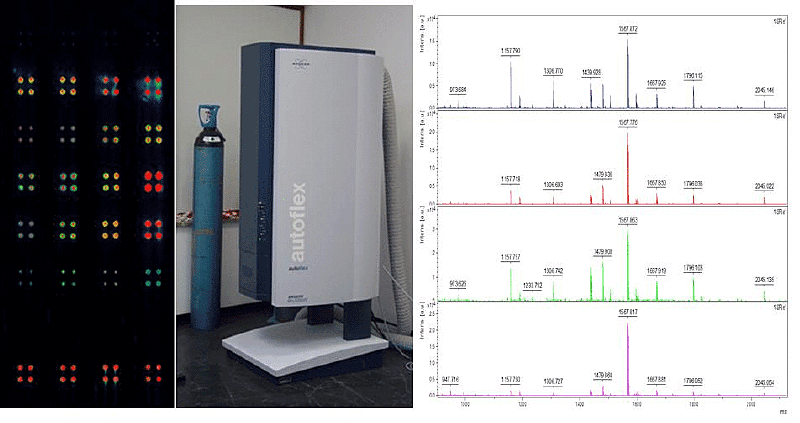
| Figure 1: Experimental set-up. (left) Samples were printed on a gold coated glass slides; the array printing was realized in a special geometry for MS analysis. The spots of 300 microns were printed in 12 boxes of 10x10 printed with SNAP genes (p53, CDK2, Src-SH2 and PTPN11-SH2), lower boxes were printed with master mix as negative control. (cente) SNAP-NAPPAs were analyzed by MALDI-TOF MS. For Bruker MS analysis the matrix was mixed with the trypsin digested fragment solutions directly on the slides and let to dry before the analysis. (right) Mass spectra summation with the arrows pointing at the theoretical peak position. |