 |
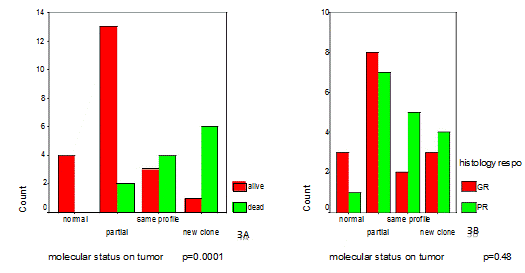
| Figures 3: (A) is presenting the statistical correlation between the 4 subgroups of molecular response on tumor resection and the percentage of deaths in each subgroup of molecular response. In the (B), no correlation was highlighted between the molecular responses and the histological response on tumor resection. (Normal=complete molecular tumor response, partial=partial molecular response in the surgical resection, same profile=poor molecular responders with the persistence of same molecular rearrangements and new clone=resistant tumors with the appearance of new cellular clones after neoadujvant treatment). |