 |
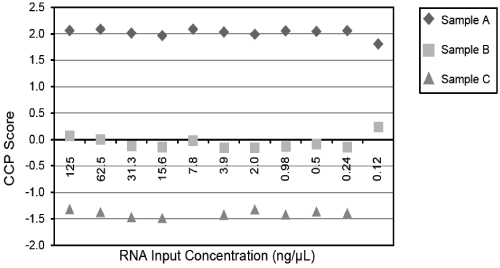
| Figure 1: Precision of individual genes within the signature. The SD of eachtarget (black) and housekeeper (gray) gene is graphed and the error barsrepresent the 95% confidence intervals. The SD of the target CCP genes is onthe ΔCT scale, while the SD of the housekeeper genes is on the CT scale. |