 |
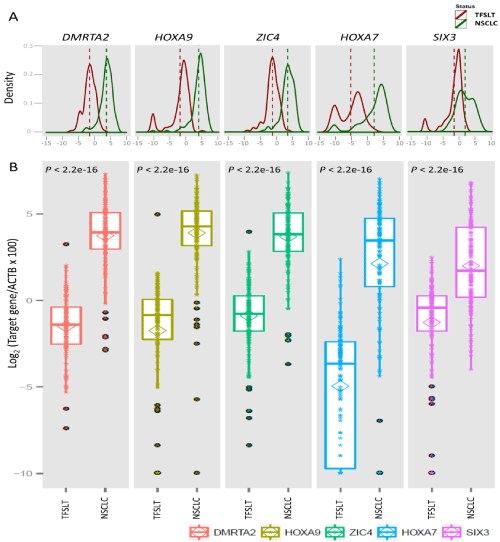
| Figure 1: Methylation levels of DMRTA2, HOXA9, ZIC4, HOXA7, and SIX3 genes in 150 NSCLC tumors and 142 TFSLTs. (A) Distribution of log transformed methylation levels in NSCLC tumors and TFSLTs. (B) Boxplots showing the difference of methylation levels between NSCLC tumors and TFSLTs. Methylation levels were log transformed. |