 |
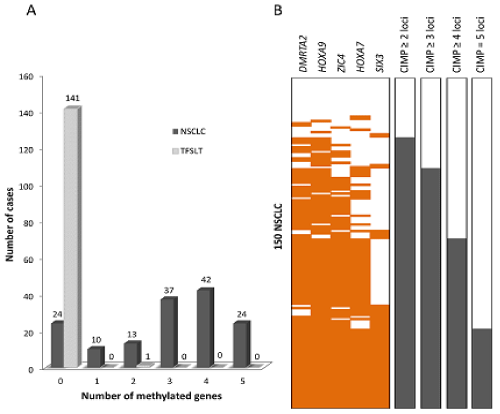
| Figure 4: Comethylation of the five tumor-specific methylated genes and their distributions in NSCLCs. (A) Histogram showing numbers of cases with different numbers of co-methylated genes in 150 tumors and 142 TFSLTs. (B) Dichotomous heat map demonstrating CIMP phenomenon in NSCLCs using different numbers of methylation markers. On the heat map, orange bars indicate NSCLC samples with sPMR ≥ 8, and white bars indicate NSCLC samples with sPMR < 8. To the right of the heat map, grey bars indicate “CIMP +” samples, white bars indicate “CIMP –” samples. |