 |
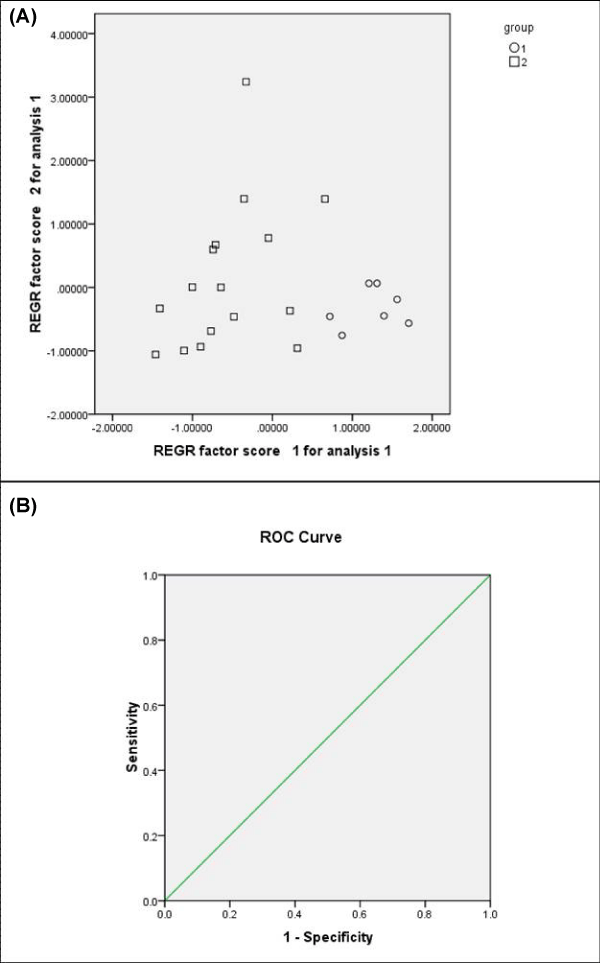
| Figure 3: A: PCA scores plot showed different urine samples from normal and tumor-bearing mice were scattered into different regions. Group 1 indicates normal mice, while group 2 means tumor-bearing mice. B: ROC (receiver operating characteristic) curves, AUC=1.0. AUC: area under the curve. |