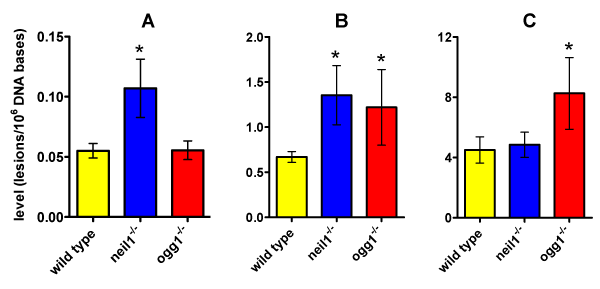
Figure 7:
Levels of S-cdA (A), FapyGua (B) and 8-OH-Gua (C) in livers of control,
neil1
–/–
and
ogg1
–/–
mice. Stars denote statistical significance (p<0.05). The uncertainties are standard deviations (from ref. [139]).