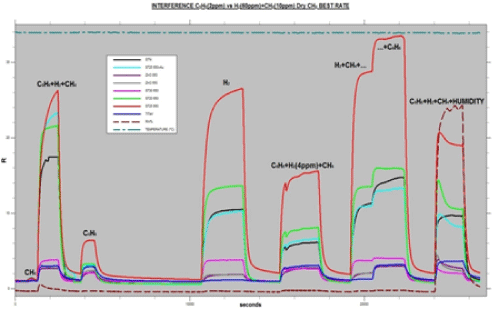
H2 at nearly the same concentration of C6H6 (5th peak), H2 + CH4 and delayed addition of C6H6 (6th peak). Temperatures chosen are those at which the sensor responses
to CH4 are the lowest as compared to C6H6.
 |
| Figure 4: sensors responses (normalized to 1), as a function of time, to C6H6 + H2 + CH4 (1st peak), CH4 (2nd peak), C6H6 (3rd peak), H2 (4th peak), C6H6 + H2 + CH4 with H2 at nearly the same concentration of C6H6 (5th peak), H2 + CH4 and delayed addition of C6H6 (6th peak). Temperatures chosen are those at which the sensor responses to CH4 are the lowest as compared to C6H6. |