 |
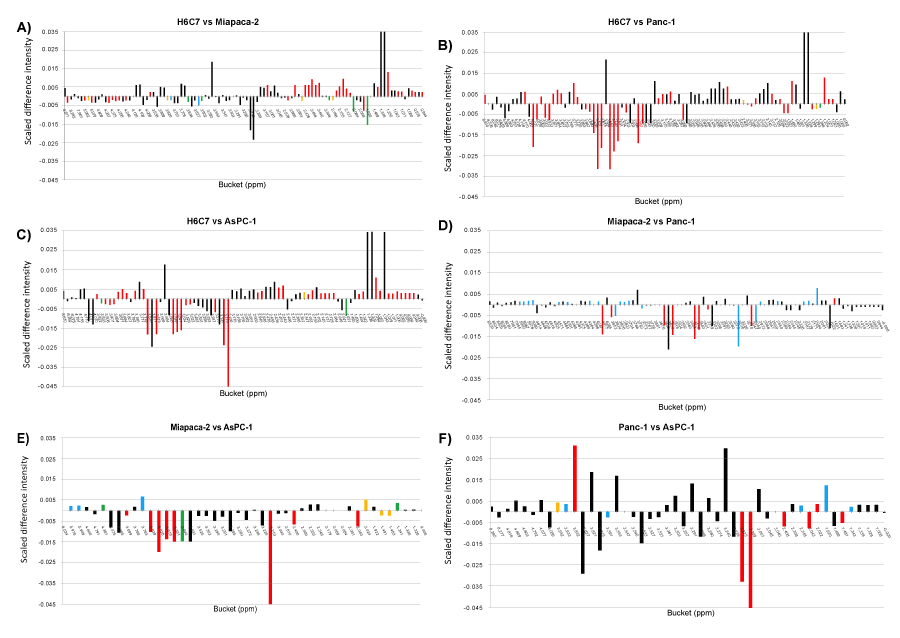
| Figure 4: Heat-map color-coding of one-dimensional plot of mean differences calculated for bucket intensities for hydrophilic extracts; A) H6C7 and Miapaca-2, B) H6C7 and Panc-1, C) H6C7 and AsPC-1, D) Miapaca-2 and Panc-1, E) Miapaca-2 and AsPC-1, F) Panc-1 and AsPC-1. Scaled difference intensities were calculated by subtracting one normalized mean value from another. The heat maps are color-coded according to bucket p-values: Black (>α-value), Blue (α-value - 10-5), Green (10-5- 10-6), Yellow (10-6 - 10-7), Red (10-7- 0). |