 |
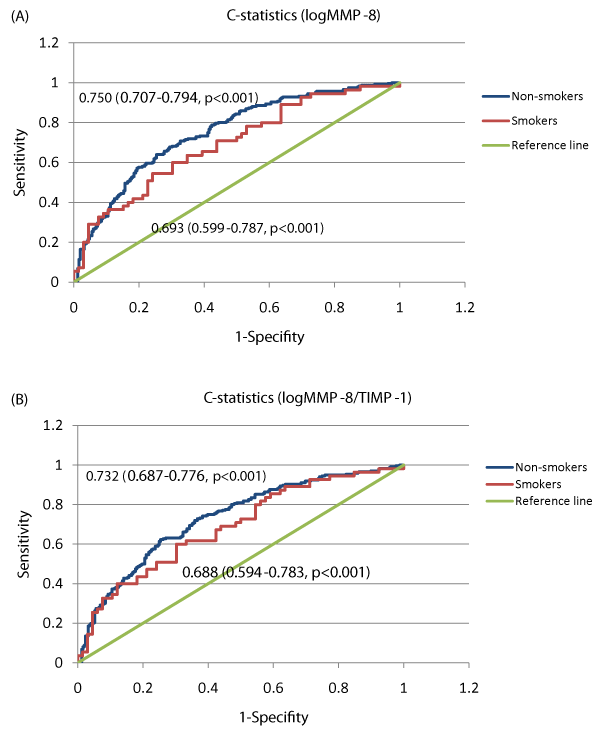
| Figure 1: A and 1B: C-statistics of MMP-8 level and MMP-8/TIMP-1 ratio for ACS separately for smoking and non-smoking subjects. Serum MMP- 8 and TIMP-1 concentrations were determined in a case-control sample (n=605). The molar ratio of MMP-8 and TIMP-1 was calculated and the MMP-8 concentrations were log-transformed. ROC analyses for ACS were performed using predicted probabilities produced by logistic regression models adjusted for age and sex. AUC, 95% CI, and p-values are presented in the figures shown for A) MMP-8 levels and B) MMP-8/TIMP-1 ratio. |