 |
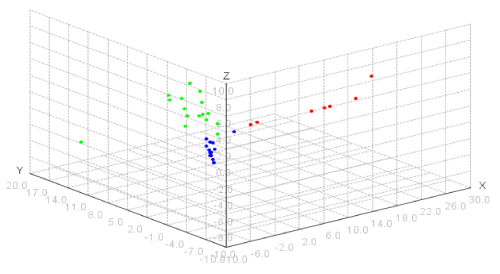
| Figure 5: Principal component analysis (PCA) showing luminal, basal and ERBB2 subgroups. Normalised expression values of the 10 classifier genes generated by the QuantiGene® Plex assay predict the various breast cancer subgroups. The blue subgroup represent patients with high expression of basal markers; the green subgroup represent patients with high expression of luminal markers and the red subgroup represent a high ERBB2 expression. |