|
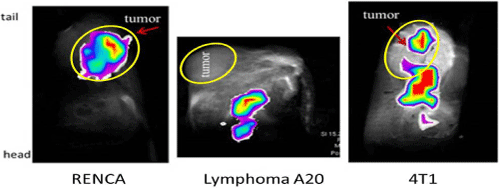
| Figure 5: In vivo (iv. injection) 13C imaging in three subcutaneous cancer animal models: The carbon-13 images (false color) illustrate the difference in the biodistribution of hyperpolarized DES after intravenous injection of 20 μmol of contrast agent in three types of allograft tumor animal models: RENCA, lymphoma A20, and breast 4T1. Tumors are circled in yellow and labeled. In all five RENCA tumor bearing animals, the majority of the 13C signal is seen within the tumor (as seen above) or at edges of the tumor. In seven out of eight lymphoma A20 tumor bearing animals, the majority of signal is seen outside of tumor in the main body of the animal similar to the image above. The biodistribution of the compound was more mixed in the six 4T1 breast tumor bearing animals. In 50% of the animals, signal is detected at the edges of the tumor (as in image above) while the other half of the animals no signal is detected in the tumor. In summary, ten to thirty seconds after injection RENCA tumors take up the majority of hyperpolarized DES while lymphoma A20 and 4T1 breast tumors have significantly reduced uptake. |