 |
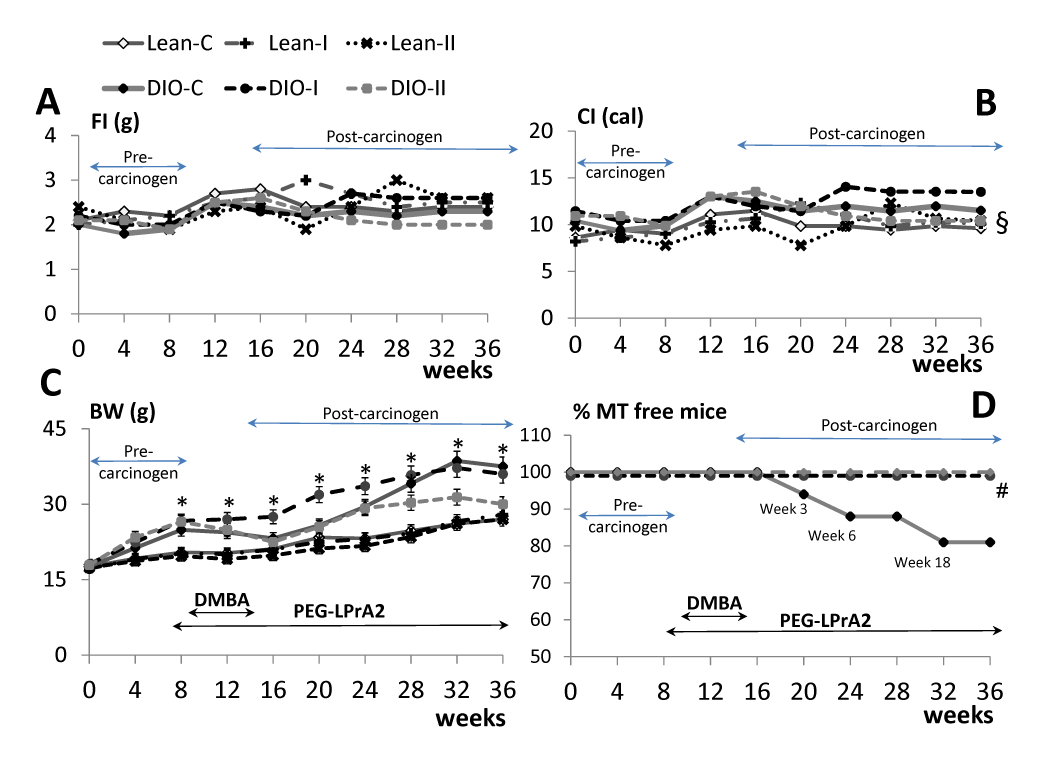
| Figure 1: Impact of diets and PEG-LPrA2 treatment on food intake (FI, grams), caloric intake (CI, calories), body weight (BW, grams) and incidence of mammary tumors (MT) in C57BL/6J mice challenged with DMBA. (A) Changes in weekly FI, (B) CI and (C) % BW change respect to BW of lean control (L-C) along the experimental period. Lean (n=20; fed low-fat diet: 10% cal-fat) and DIO-mice (n=28; fed high-fat diet, HFD: 55% cal-fat) were treated with PEG-LPrA2 [once (I) or twice (II) a week] or received saline injections. (D) Cumulative percentage of MT-free mice. The Kaplan–Meier curves represent DIO-mice treated with saline or PEG-LPrA2 (DIO-I and DIO-II). PEG-LPrA treatment started 2 weeks previously to DMBA challenge (6-weeks/1 mg/ week) and continued to the end of the experiment (32 weeks). MTs were detected in DIO-C mice at weeks 3, 6 and 18. Obesity was defined as: BWDIO > BWL-C + 2SD. (§) p<0.01 when comparing CI in DIO-C and DIO-I to DIO-II, L-C, L-I and L-II. (*) p<0.05 when comparing BW of lean to DIO-mice. (&) p<0.05 when comparing BW of DIO-C and DIO-I to DIO-II mice. (#) p=0.03 (likelihood-ratio Chi2 test) when comparing MT incidence in non-treated (DIO-C) to PEG-LPrA treated mice (DIO-I and DIO-II). |