 |
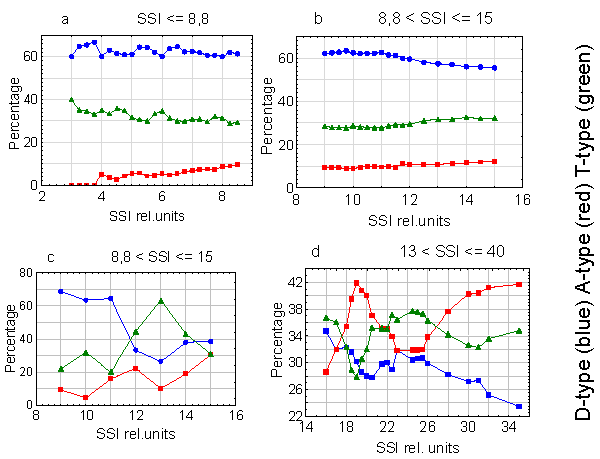
| Figure 4: The percentage ratio between the three ploidy tumor entities and SSI. During three accumulatively increasing intervals of SSI values (a, b and d), mutual alterations in the percentages of D- , T- , and A-type tumors are shown. To increase the resolution, the accumulative curve in (b) was changed to values of separated intervals in (c). This reveals the tetraploid peak more clearly. |